We Should Test More on the Weekends.
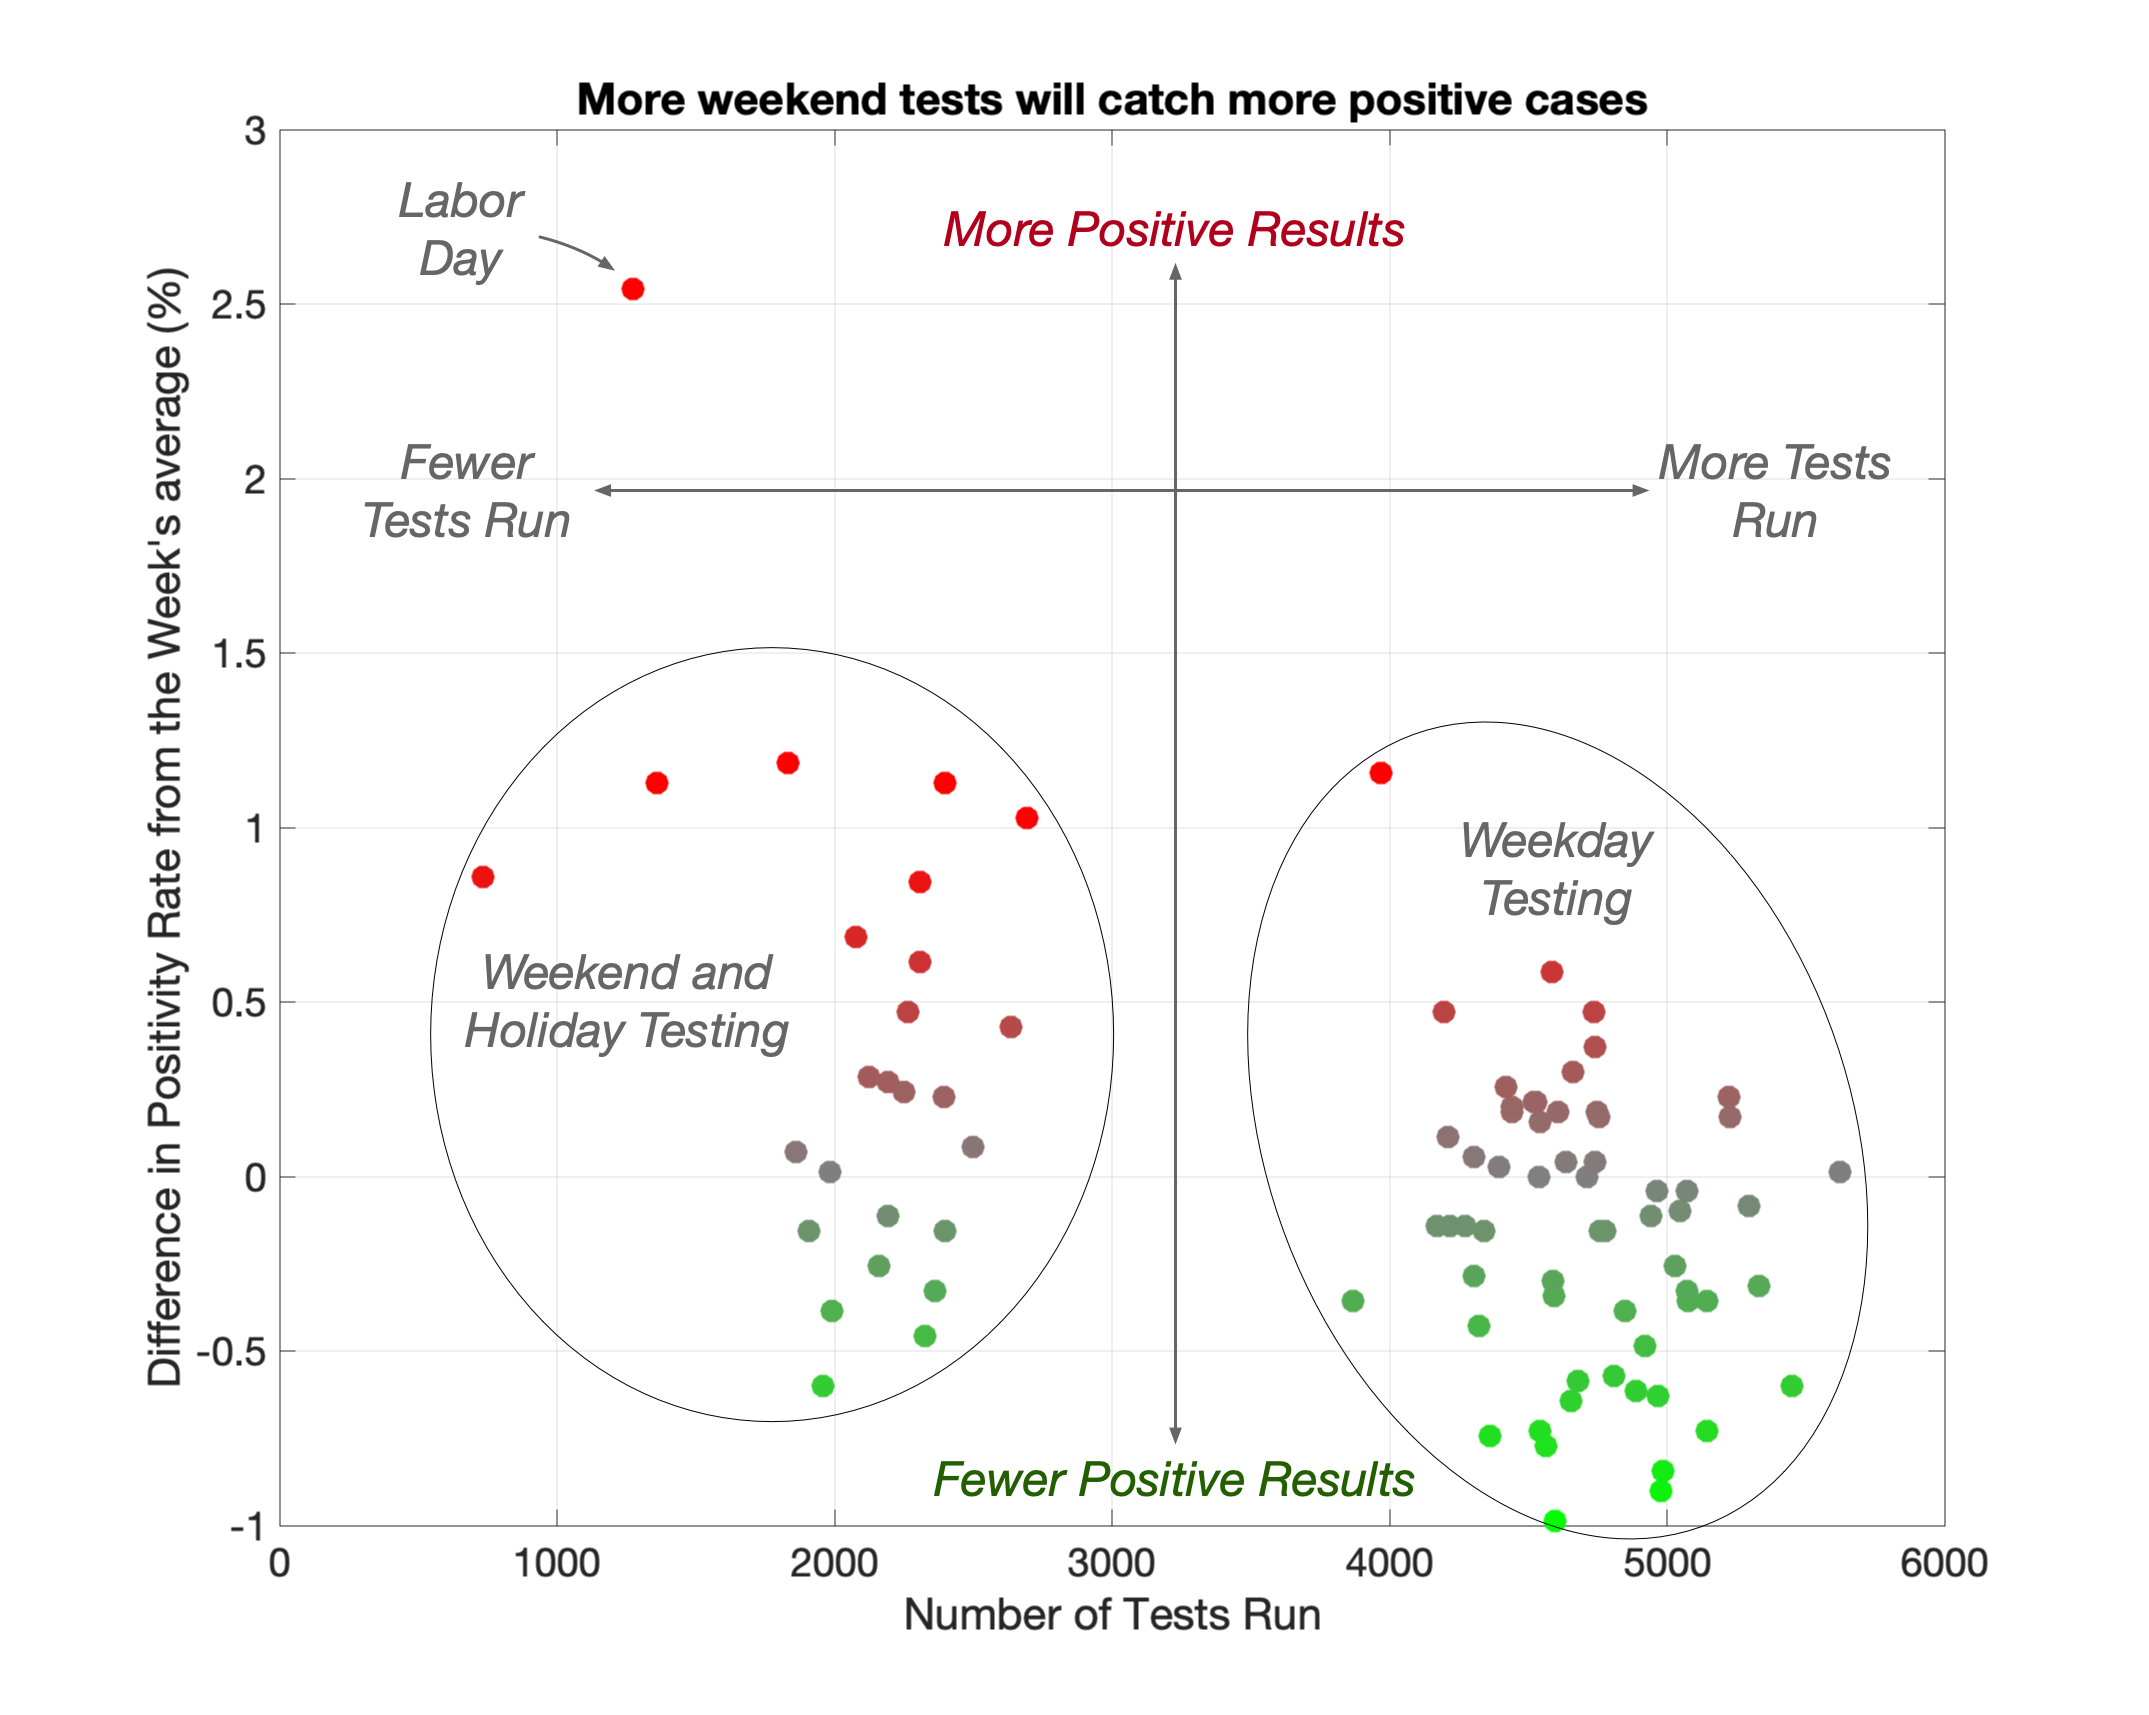
This plot shows that San Francisco finds proportional more COVID-19 cases on the weekends than the weekdays.
COVID-19 doesn’t take a break over the weekend and so San Francisco should have testing that is widely and easily available on the weekends. Weekend testing needs to be available so that
People who have jobs during the weekdays can easily get tested.
People who start to feel sick on the weekend can get tested and quarantine a day or two early which makes all the difference in the spread.
Yet what do we actually see. San Francisco’s testing rate dips consistently every weekend. And on top of that on these same days that have low testing counts the positivity rate rises. San Francisco would be better served by making precious testing resources available on the weekends.
For San Francisco to have a positivity rate that is believably low it must run tests and run test sites in such a way that it is ferreting out all the positive test results it possibly can. Looking at the data that’s not happening right now.
A Brief Description of the Plot
Looking at the plot above we’ve never had a weekend day or holiday where more than 3000 tests were run. And yet if you look at the color of the weekend dots they are much more red than the weekday dots. This means that the weekend are producing more than their fair share of positive results. We should deploy tests and testing effort where the positive results are. Right now the greater share of positive results is on the weekends, not the weekdays.
The real outlier in this plot is Labor Day in which there were very few tests and a phenomenally high positivity rate. I don’t know what was happening here but something interesting.
Further explanation
A pattern in the number of tests run.
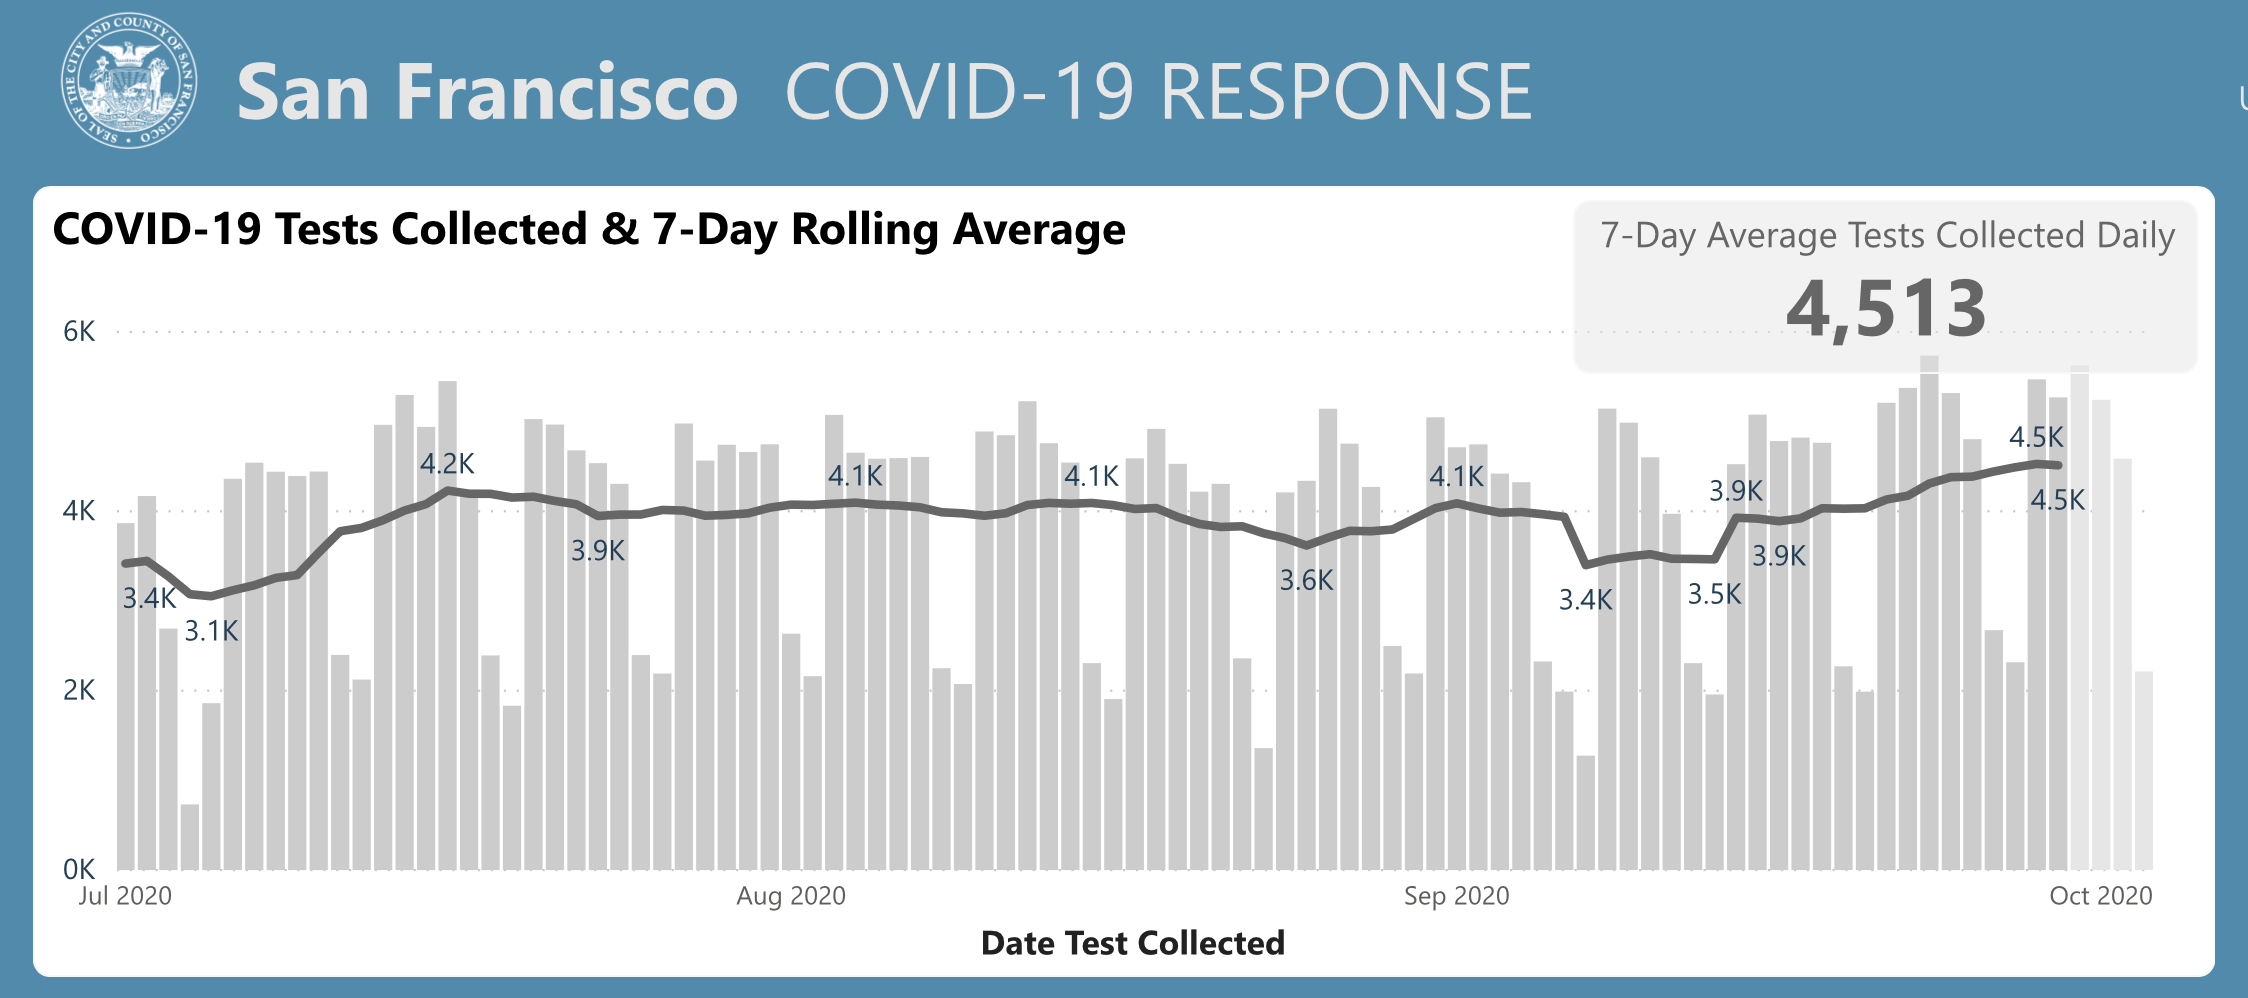
If you look at San Fransisco’s testing dashboard to the right you can see an obvious pattern. The number of tests cycles up and down every week. During the weekday lots of tests are being run and during the weekends and holidays relatively few tests are being run.
You can see by eye that the number of tests run on any weekend or holiday day never exceeds the number of tests ever run on a weekday. The number of tests run should reflect the disease not the work week. The degree of disparity felt wrong and I wanted to know if the number of tests being run affected the results.
Look at positivity rate and develop a color scheme.

To make a correlation between the number of tests run and the positivity rate more obvious I took San Francisco’s positivity graph and colorized it. San Francisco employs a weekly average to smooth much of its data out and the positivity rate data is no exception. Notice in SF’s graph certain days poke up above the running average and some days drop below the average.
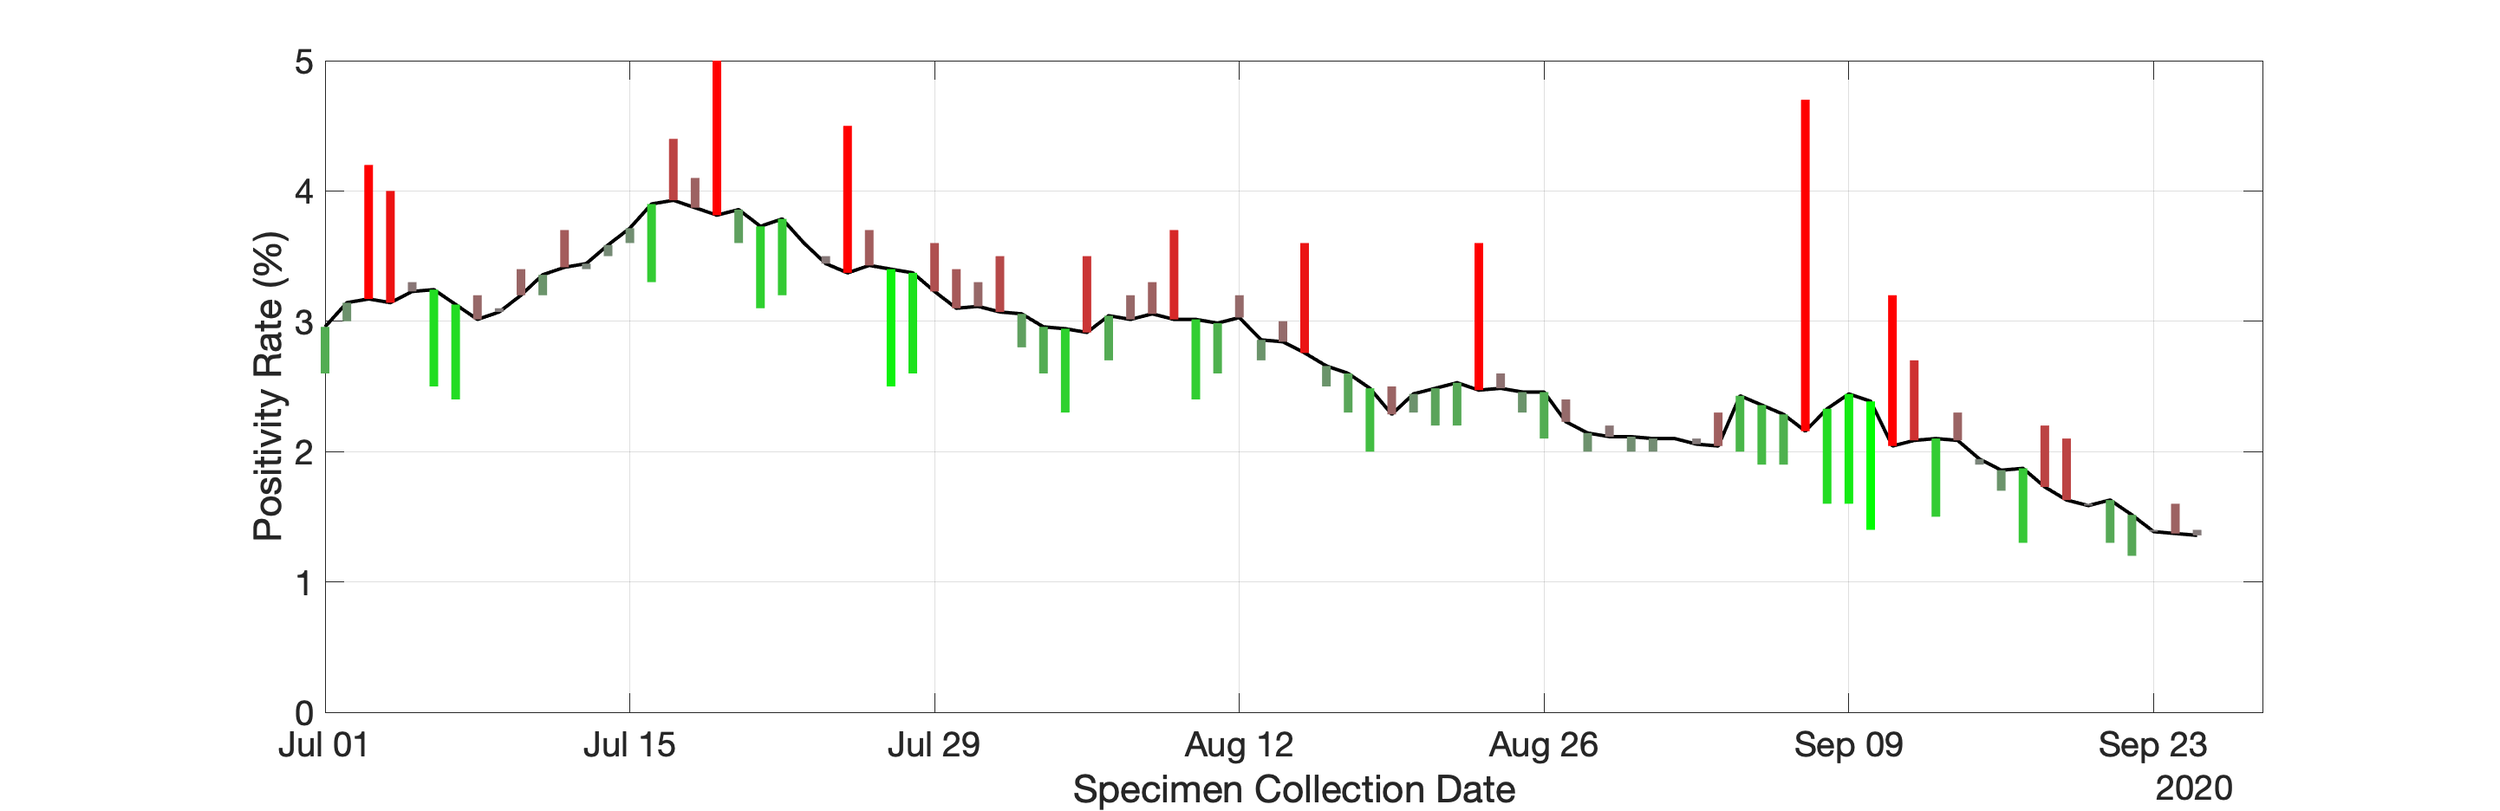
The curve pictured here and the one above are the same data just presented differently. I used red in my colorized graph to indicate a day whose positivity rate sticks up above the weekly average. I used green to indicate a day whose positivity rate drops below the weekly average. If the positivity rate is more than 1% above the average, it is bright red. If the positivity rate is more than 1% below the average it is bright green. Anything in between +1% and -1% becomes a shade of reddish gray or greenish gray. A pure gray line or dot represents a day that is neutral, neither above or below the average.
Create a scatter plot
Now we plot the two variables, number of tests run in a day versus the positivity rate for that day. Actually the second variable is more accurately described as the change of positivity rate on that day compared with the average for the week. By plotting the data in this way we can clearly see the trend. The lower the number the tests the higher the positivity rate. This is the plot at the top of this post.
Remember we should be testing in those places and at those times that have the highest positivity rates. What we want is for San Francisco to have a low positivity rate despite SFDPH’s and others best efforts to get a high positivity rate.
Testing needs to be made more available on the weekend and people need to be encouraged to get tested on the weekend.
One explanation is that only the sickest people go to get tested on the weekend which results in a higher positivity rate. (ie only desperate people are getting tested on the weekend.) However this means that we are not catching COVID-19 cases as early as we should be. The earlier we can catch cases the earlier we can isolate and quarantine people to help slow the spread.
San Francisco should be making more testing available on the weekend and needs to be encouraging people to get tested over the weekend. It is continual improvements like this one that will keep San Francisco on the path to continued reopening. As the number of cases get lower and COVID-19 fatigue sets into us all further and further SFDPH and others on the front line of this fight need to become more and more nimble. This is just one improvement.