Are We Testing Enough to Reopen?

What are the Current Testing Rates?
What are the Trends?
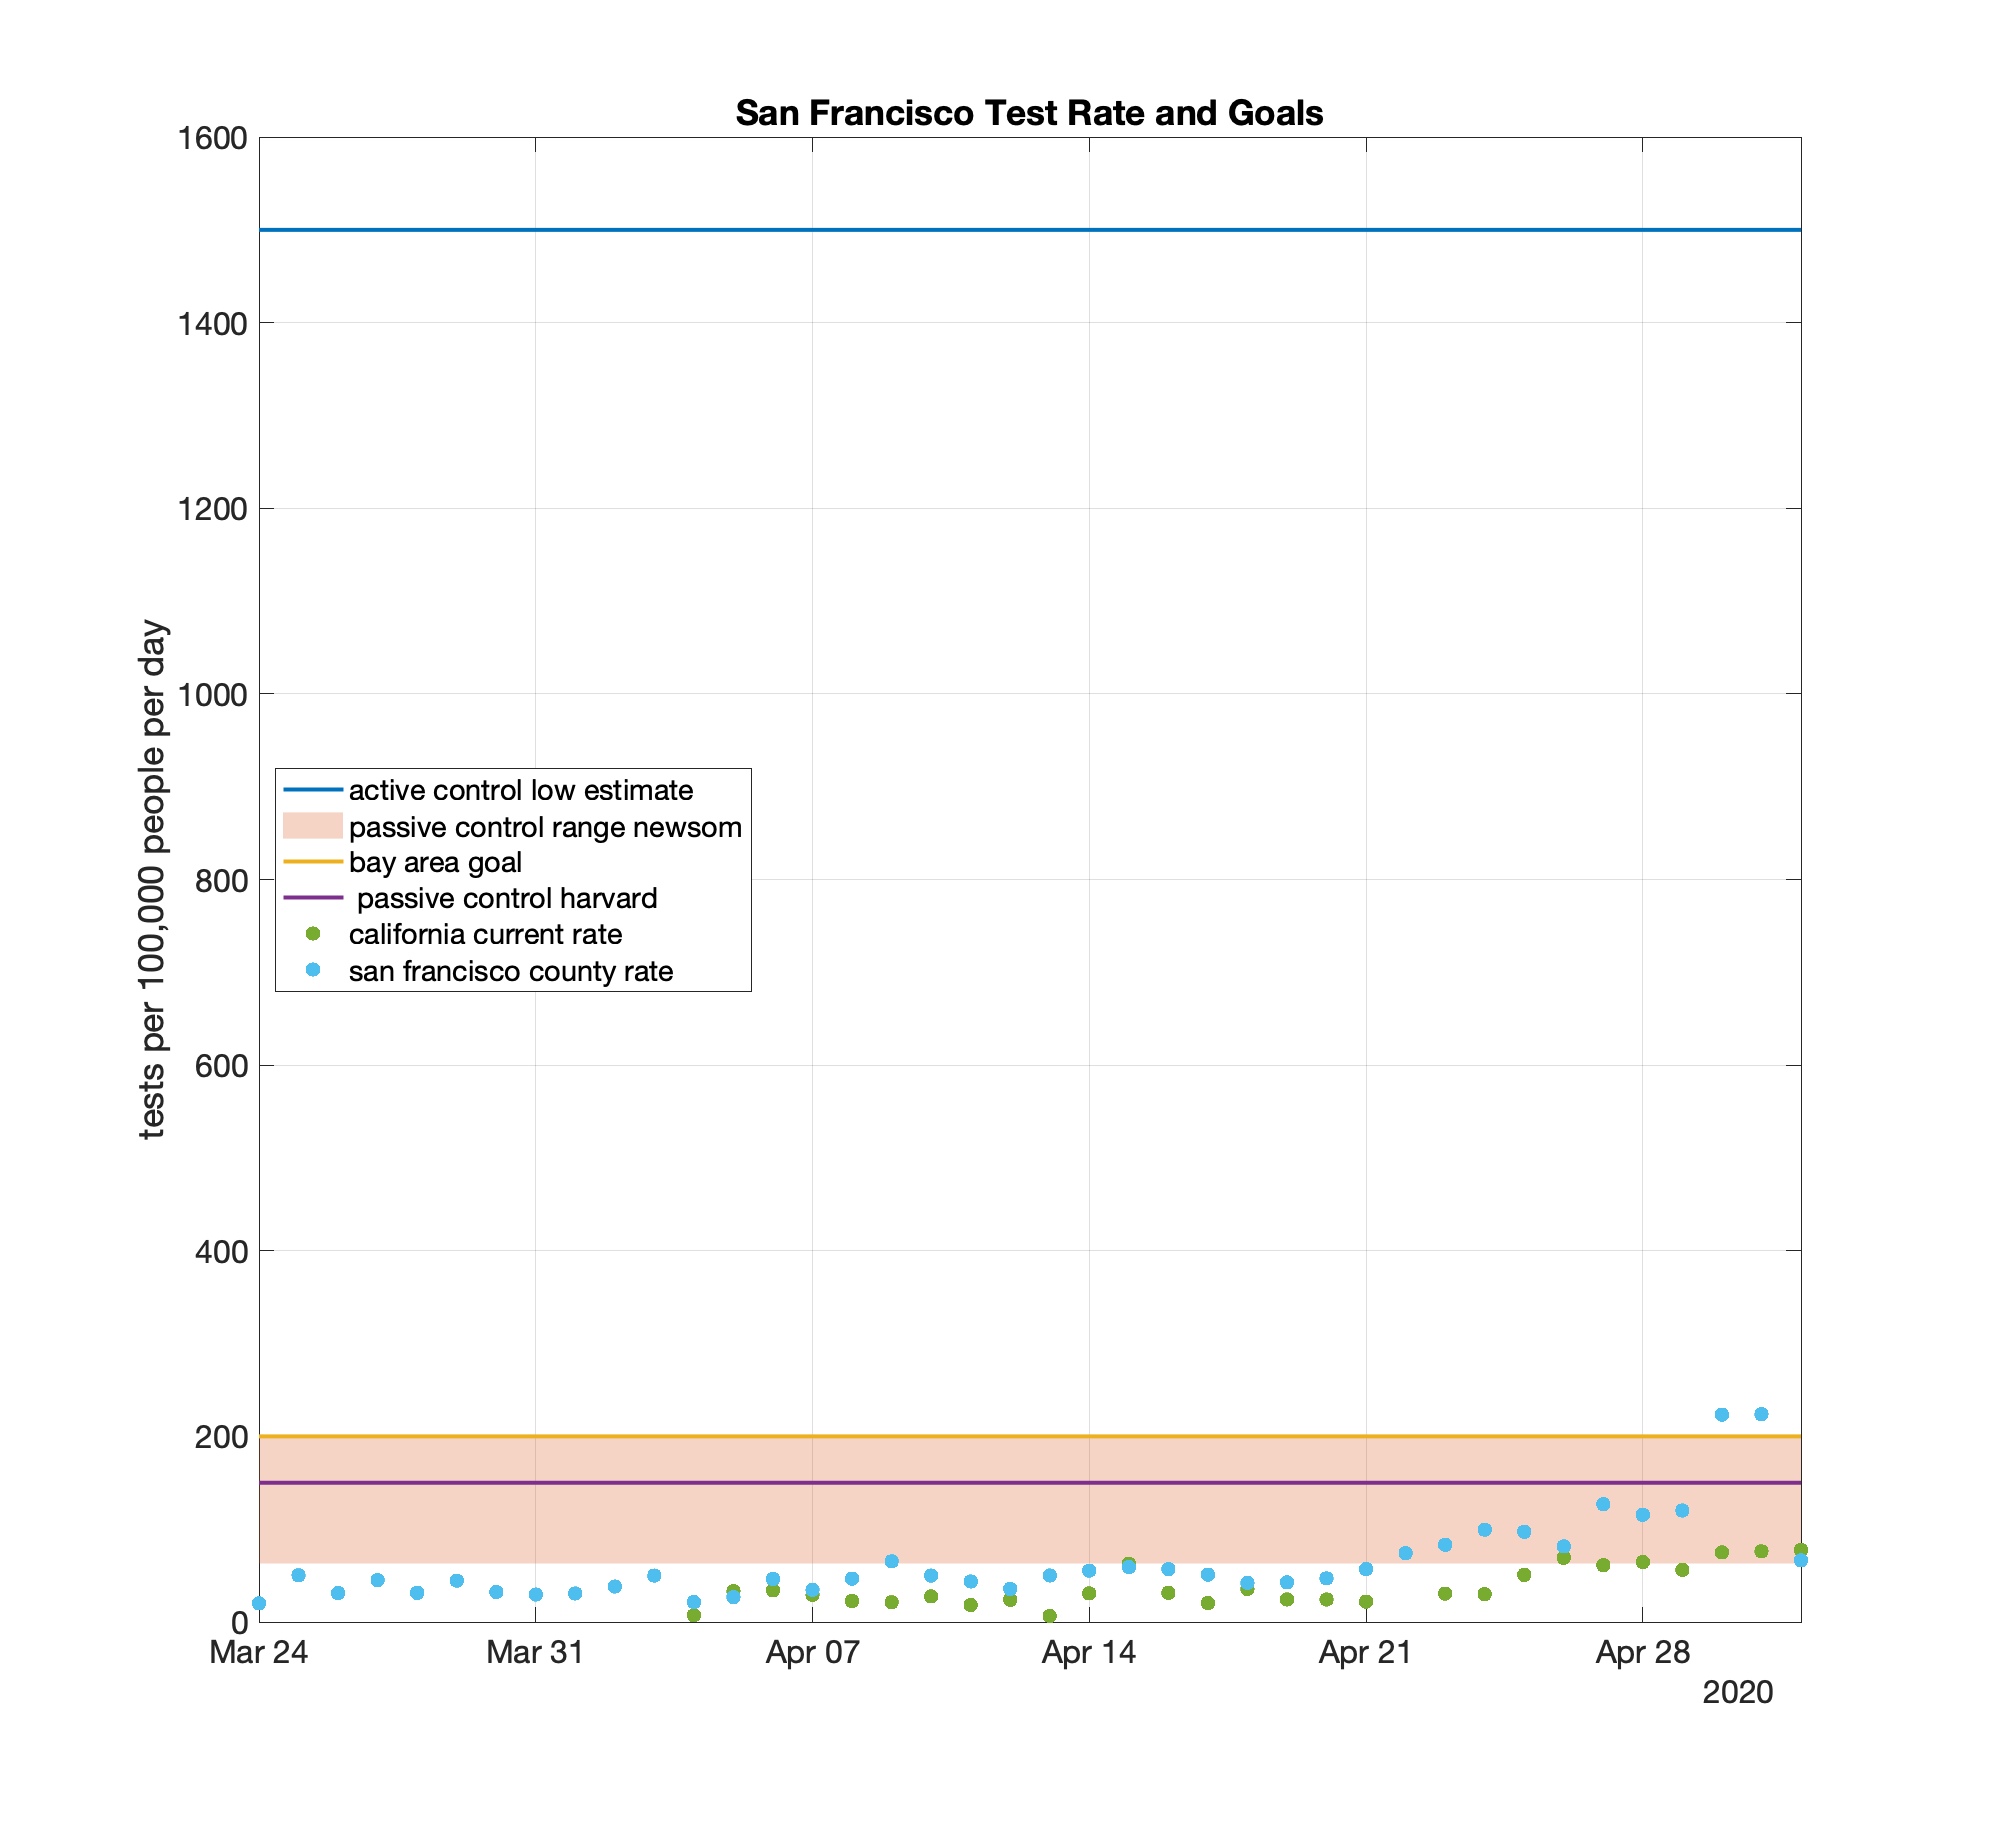
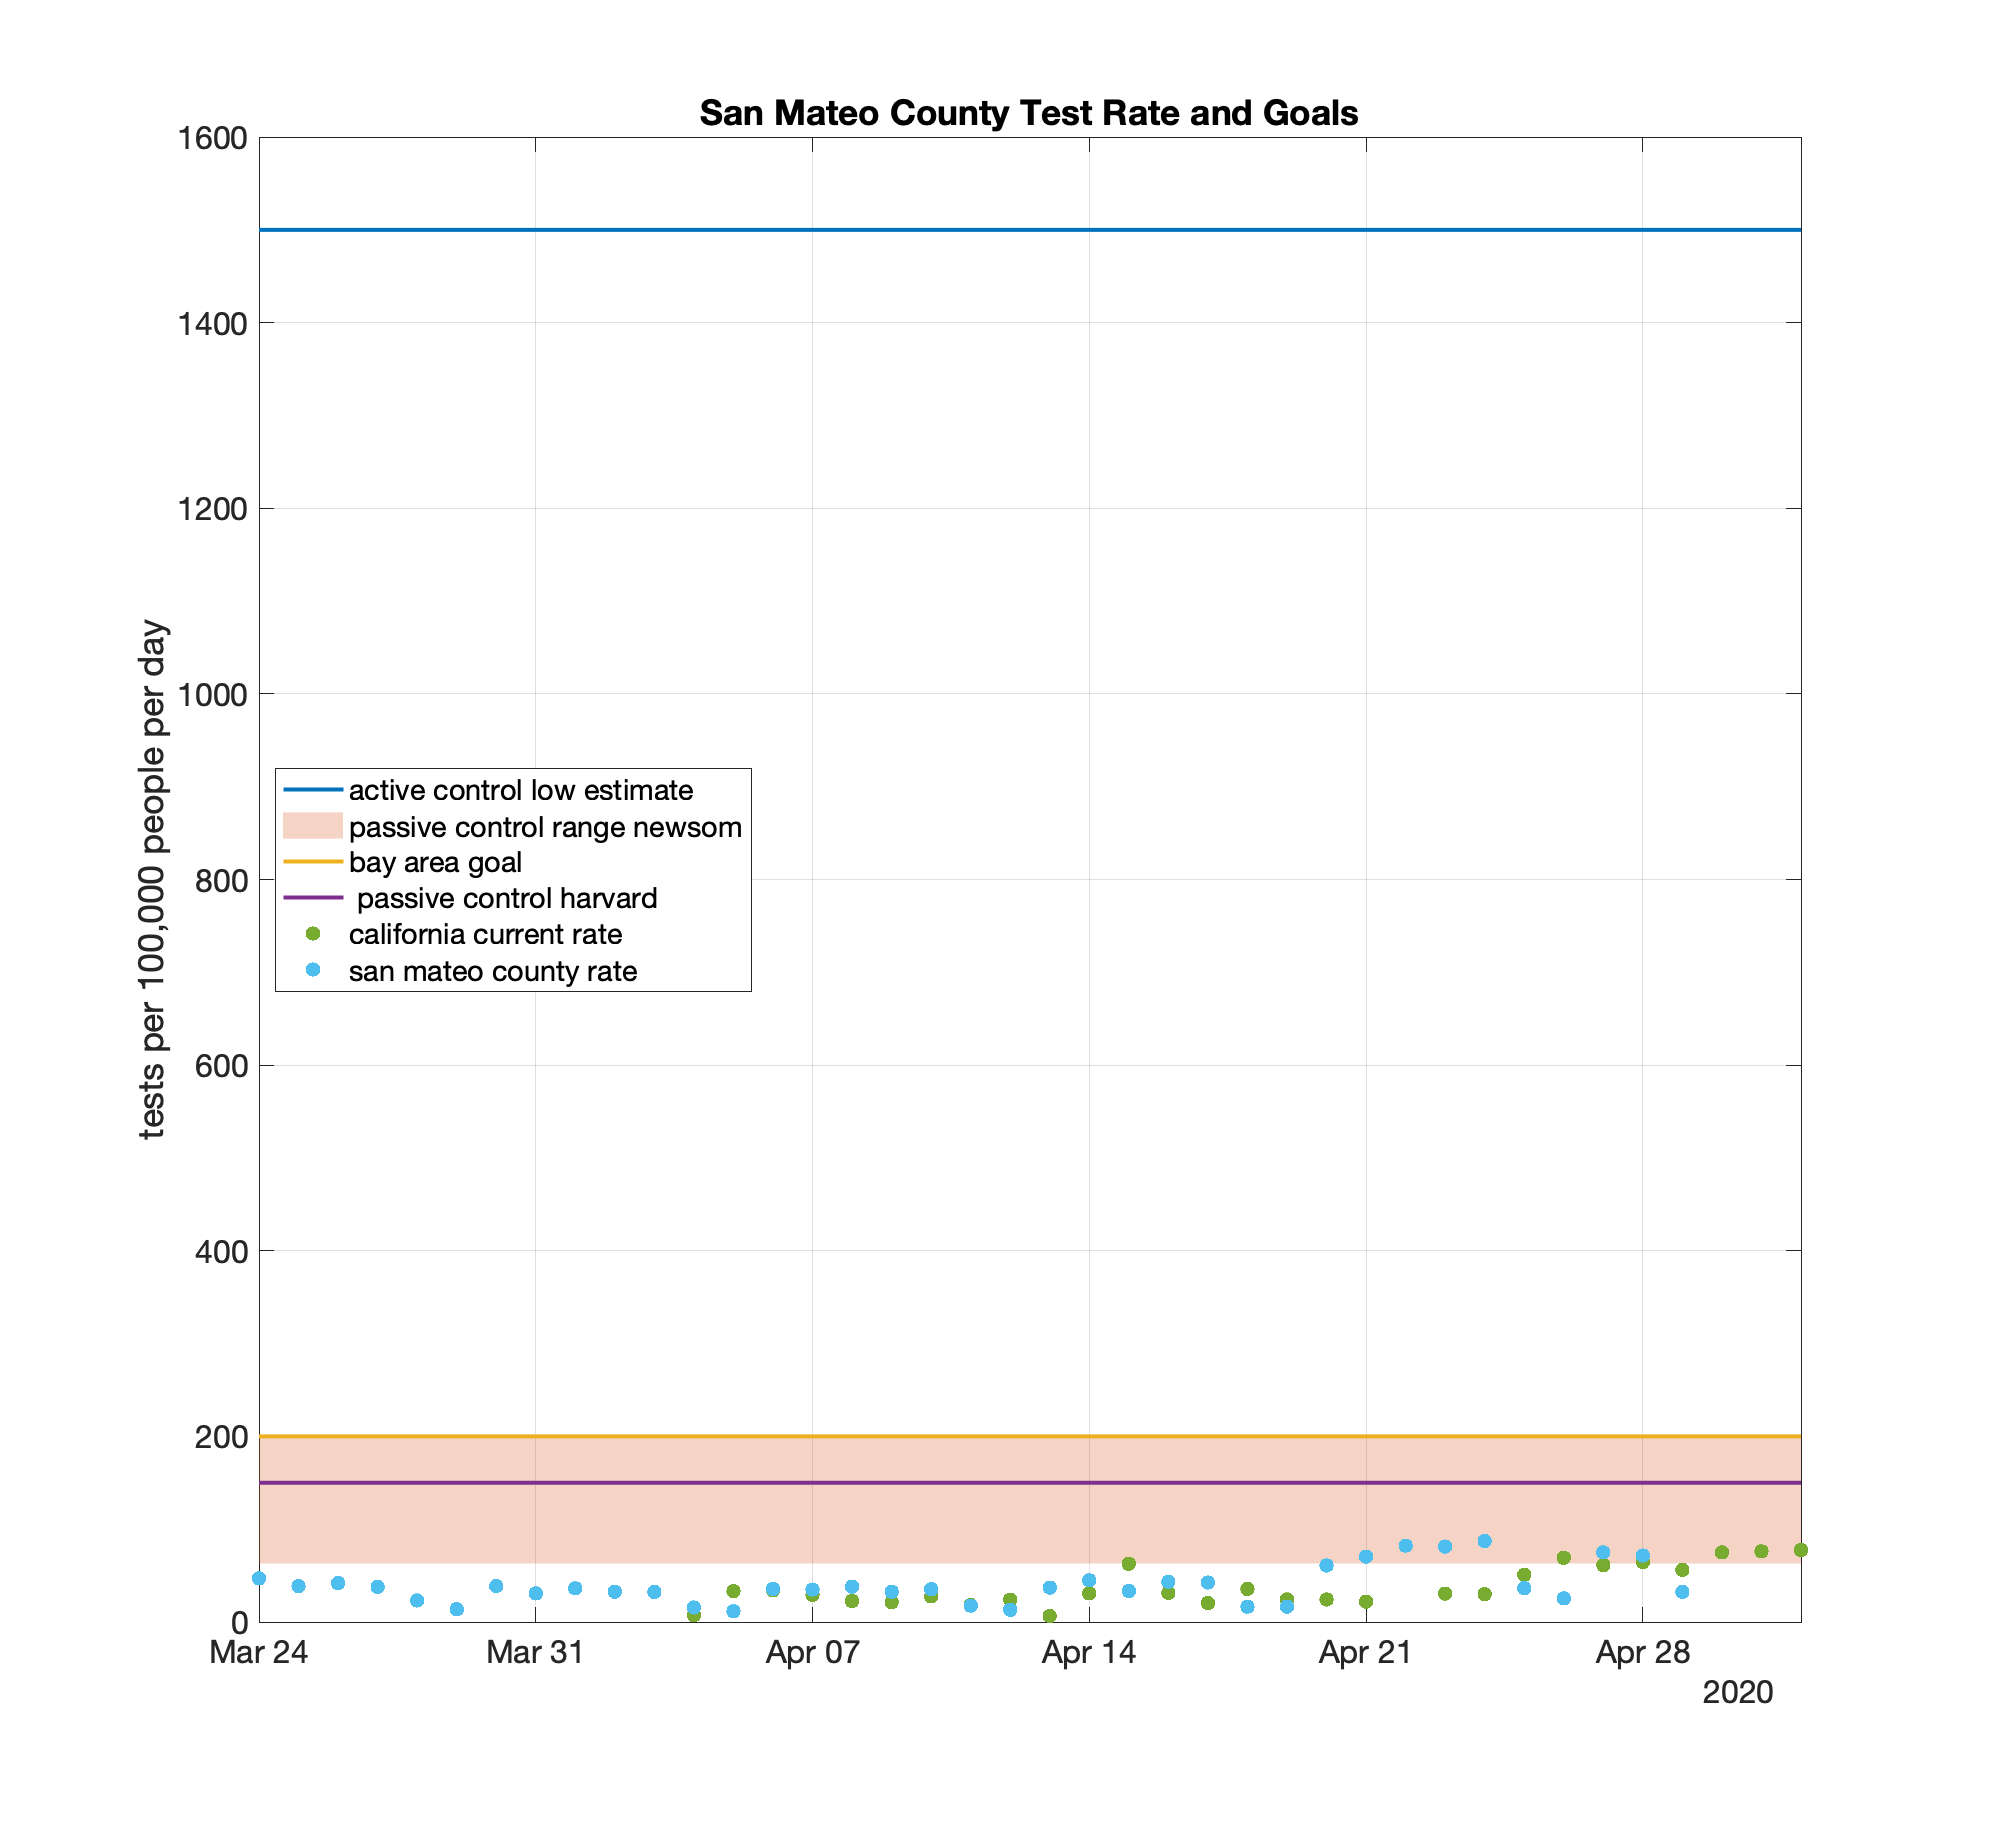
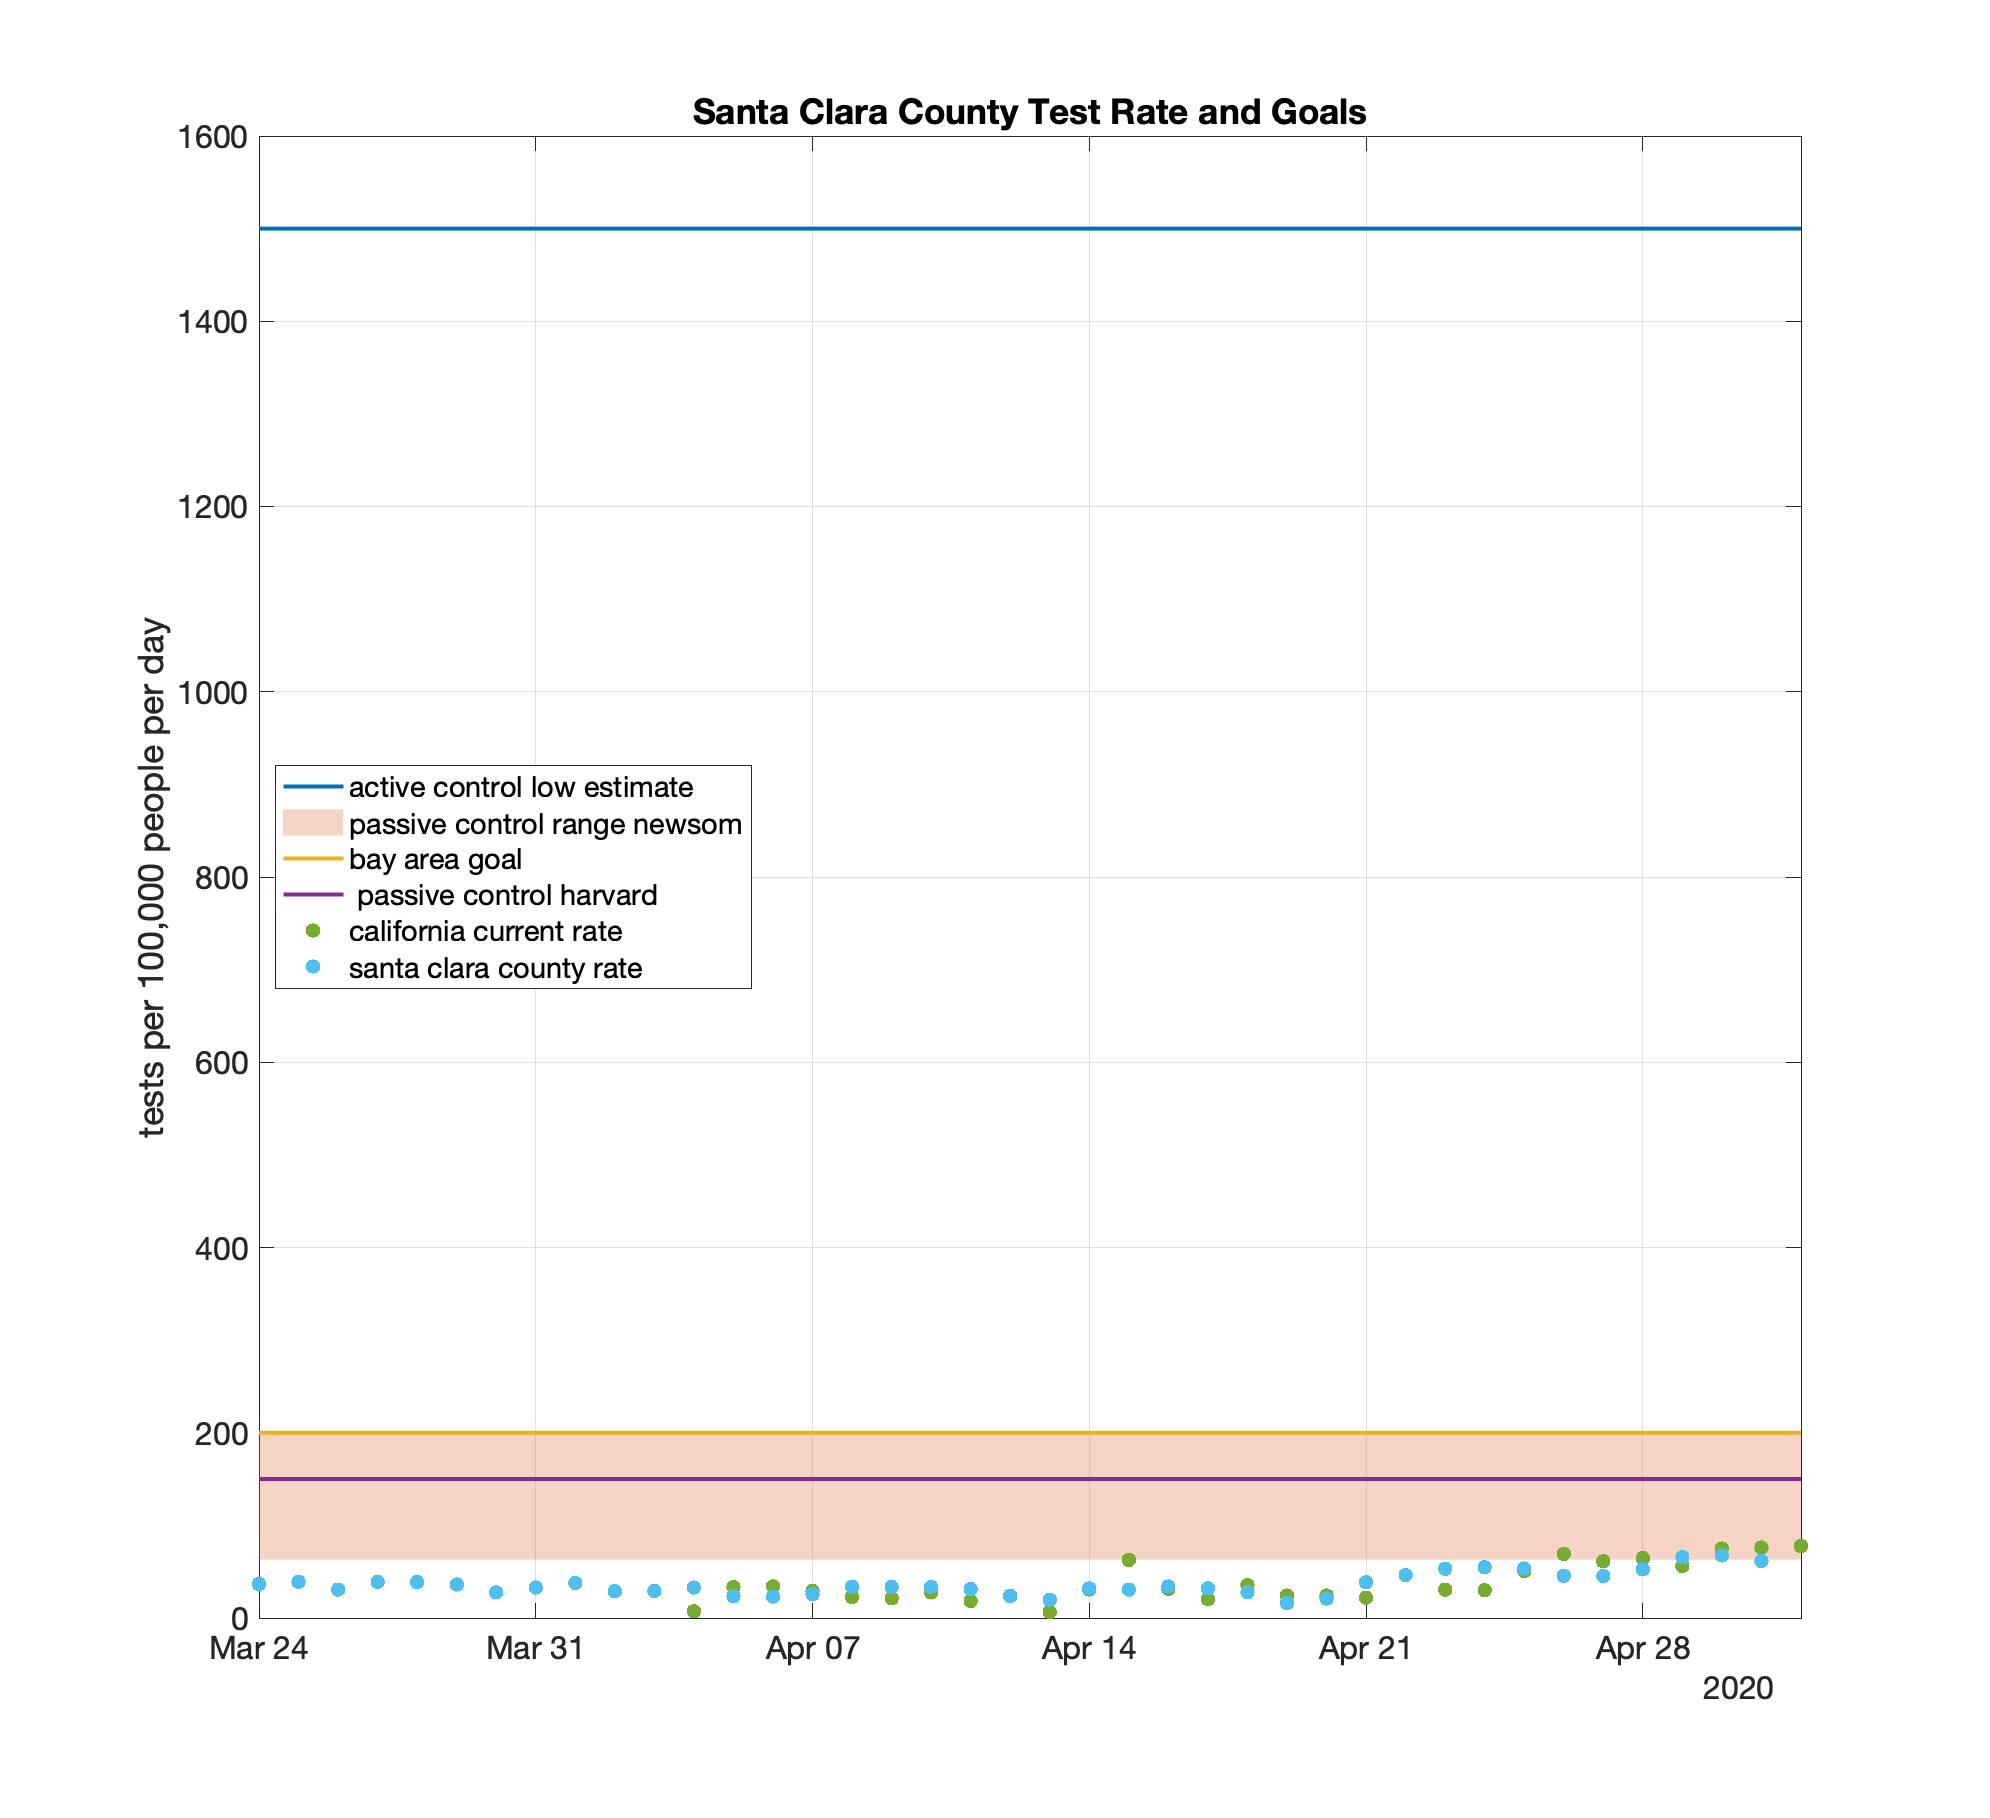
There are four Bay Area counties, San Francisco, San Mateo, Contra Costa, and Santa Clara, that publish the historical number of tests being run on their dashboards. I have plotted those testing rates, taking into account the population of the county. A larger county will need to run more tests than a smaller county. The numbers shown above take this effect into account. Notice that San Francisco seems to be the only county with a distinctly upward trend. The other three counties testing numbers are not going up consistently. The remainder of the Bay Area counties aren’t even putting up their numbers in a way that I can plot them.
Are these Testing Rates Enough?
Like so much in this Pandemic you look around for recommendations and you get so many conflicting answers. I’ve chosen as reference levels three different sources.
California Governor Gavin Newsom goals range from 60 to 200 tests per day per 100,000 residents. This comes from his stated goals of testing reaching rates of 25k per day up to 80k per day in a state with 39.5 million residents. Mercury News
Harvard Study goals set at 152 tests per day per 100,000 residents. There seems to be a widely quoted Harvard estimate that states the testing need at 1.5 residents tested per 1000 per day. New York Times Article
Pandemic-Resilience whitepaper goals set set at 1500 to 6000 tests per day per 100,000 residents. This white paper sets a goal of 5 Million - 20M tests per day in the United States. In a country of 328 million people this works out to a rate of 15 to 60 tests per 1000 residents per day. pandemictesting.org whitepaper and /or Vi Hart YouTube Video
Why the Difference in the Rates?
Note that the Harvard rate and the Newsom rates overlap and the Pandemic resilience rates are way off the charts. (I haven’t even plotted the high range of the Pandemic Resilience whitepaper.) As best as I can currently figure out at the moment this difference is due to completely goals. It seems like the Newsom and the Harvard goals are passive monitoring. Testing at these rates is just looking to adequately measure the COVID-19 epidemic and be able to react to it before it becomes too late. With testing at this scale you could implement more nuanced shelter in place orders and you can ensure that hospitals don’t become overloaded.
The Pandemic-Resilience goal is active control. This ambitious paper suggests we actively track and trace all contacts and quarantine people so that we can all live our lives more or less regularly. This is more similar to what was done in South Korea and Taiwan.
San Francisco’s testing rate is headed in the right direction. My city looks to be doing enough testing to begin to ease the shelter in place orders. However it is only enough testing to keep us from heading into chaos as shelter in place restrictions are removed. This testing rate seems to be enough to be able to determine what shelter in place restrictions are the right ones. It does not look to be enough testing to get life back to a normal that our former-selves would recognize.
All the other Bay Area counties testing rates seem to be even worse than San Francisco. Of course since San Francisco is so tightly integrated with the rest of the Bay Area it would be hard for San Francisco to ease restrictions on its own.
Other Food for Thought
Santa Clara county has a great page on the criteria agreed to by Bay Area health departments and the metrics needed for reopening. Santa Clara Five Key Indicators. What’s funny is that their own testing metric doesn’t seem to agree with their own dashboard. The two rates seem to be different.
The great website Covid Act Now shows three different metrics needed for reopening and you can look to see where your state and county are relative to those metrics.
There is another style of assessing whether the number of tests is sufficient and that is to look at the number of tests coming back positive. In this measure San Francisco is also doing OK. NPR
After I wrote this post last night the San Francisco Chronicle came out with the following story this morning in which they were able to bully the county health departments, in ways I can’t, to give them the numbers. Bay Area has 6 criteria for loosening coronavirus restrictions